The quantum implied volatility (QIV) model is a minimalistic model of an implied volatility surface. The aim is to capture the main features of implied volatility using a small number of parameters.
The model is derived by assuming that the implied volatility is the volatility which, when used as input to the Black-Scholes model, will produce the correct option price under the quantum model of asset price. Let x be log price change over a period T, and set z=x/√T. If we ignore the drift term, the quantum model then says that the price distribution can be modelled as a Poisson-weighted sum of Gaussians in z. If we now calculate the volatility which gives the correct option price for that distribution, then we find it satisfies
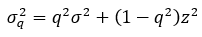
where again z=x/√T but now x represents log moneyness (see here for derivation). The only parameters are a base volatility s, and the number q which has a typical value of about 0.95.
The QIV model was tested against SPX options during the period 2004-2020. The results are shown in the figures below. The left panel shows implied volatility as a function of T and z=x/√T (chosen because the quantum model is expressed in terms of z). The option prices are averaged over each strike and expiration (from five days to one year), and the implied volatility is then computed. Put options are used for x<0 and calls for x≥0. The quantum model is shown by the red line. The right panel is an end view of the same data, which shows that the surface is independent of the period T when plotted in this way.

The results are not perfect, especially for at-the-money options, which is not surprising given that implied volatility is complicated by a number of behavioural and other effects. For example, for z near zero, put options (to the left) attract a higher price than call options (to the right). However the quantum model correctly predicts the overall V-shaped configuration that appears when the data is plotted in this way, and does a better job at more extreme strikes. Results could obviously be improved by adding more parameters, but the aim here is to show that the surface can be fit quite well using only the basic model with q=0.95.
Also, it should be noted that the QIV model is a prescriptive model, in the sense that it calculates the correct volatility to use given a quantum price distribution. If traders are using a significantly different implied volatility, then that may suggest a degree of mispricing, and therefore an opportunity for arbitrage.
For details and other applications of the model, see the paper “A quantum model of implied volatility” in the May 2024 issue of Wilmott. A pre-publication draft is also available here.

Leave a comment